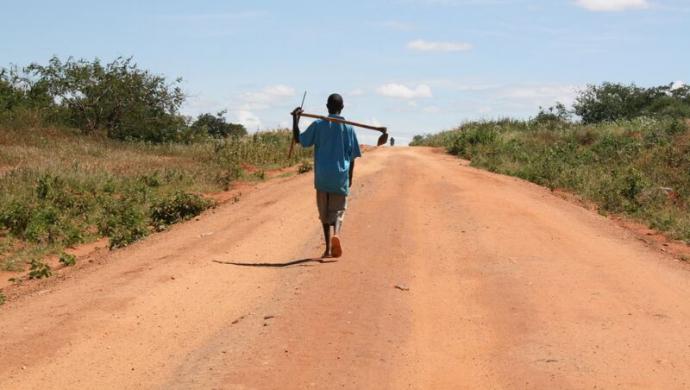
Hvis man måler penges værdi i lokal købekraft og ikke efter vekselkurser, er resultatet radikalt anderledes – i dag ligger halvdelen af alt privatforbrug uden for de “gamle” rige industrilande, men selv om de fattige lavindkomstlande står langt bedre, udgør de forsvindende lidt af den globale økonomi.
WASHINGTON, April 29, 2014 (World Bank): The International Comparison Program (ICP) released new data Tuesday showing that the world economy produced goods and services worth over 90 trillion US dollar (486 billioner DKR) in 2011, and that almost half of the world’s total output (produktion) came from low and middle income countries.
Under the authority of the United Nations Statistical Commission, the 2011 round of ICP covered 199 economies – the most extensive effort to measure Purchasing Power Parities (PPPs = måling af købekraften af ens penge) across countries ever.
ICP 2011 estimates benefited from a number of methodological improvements over past efforts to calculate PPPs.
The ICP’s principal outputs are PPPs for 2011 and estimates of PPP-based gross domestic product (GDP) and its major components in aggregate and per capita terms.
When converting national economic measures (e.g. GDP), into a common currency, PPPs are a more direct measure of what money can buy than exchange rates.
Major findings:
* Six of the world’s twelve largest economies were in the middle income category (based on the World Bank’s definition). When combined, the twelve largest economies account for two-thirds of the world economy, and 59 percent of the world population.
* The PPP-based world GDP amounted to 90,647 billion dollar, compared to 70,294 billion measured by exchange rates.
* Middle income economies’ share of global GDP is 48 percent when using PPPs and 32 percent when using exchange rates.
* Low income economies, as a share of world GDP were more than two times larger based on PPPs than respective exchange rate shares in 2011. Yet, these economies accounted for only 1.5 percent of the global economy, but nearly 11 percent of the world population.
* Roughly twenty-eight percent of the world’s population lives in economies with GDP per capita (pr. indbygger) expenditures above the 13,460 dollar world average and 72 percent are below that average.
The approximate median (middel) yearly per capita expenditures (udgifter /privatforbrug) for the world – at 10,057 dollar – means that half of the global population has per capita expenditures above that amount and half below.
Which are the largest economies?
* The six largest middle income economies – China, India, Russia, Brazil, Indonesia and Mexico – account for 32.3 percent of world GDP, whereas the six largest high income economies – United States, Japan, Germany, France, United Kingdom, and Italy – account for 32.9 percent.
* Asia and the Pacific, including China and India, accounts for 30 percent of world GDP, Eurostat-OECD 54 percent, Latin America 5.5 percent (excluding Mexico, which participates in the OECD and Argentina, which did not participate in the ICP 2011), Africa and Western Asia about 4.5 percent each.
* China and India make up two-thirds of the Asia and the Pacific economy, excluding Japan and South Korea, which are part of the OECD comparison.
Russia accounts for more than 70 percent of the CIS, and Brazil for 56 percent of Latin America.
* South Africa, Egypt, and Nigeria account for about half of the African economy.
Which countries are the most expensive?
Læs videre på
http://www.worldbank.org/en/news/press-release/2014/04/29/2011-international-comparison-program-results-compare-real-size-world-economies


