
GENEVA, 7 June, 2017 (IFRC): In the hours and days after any disaster, humanitarian organizations like the Red Cross seek answers to a few key questions: Where were people during the disaster? How many people are affected? What are their primary needs?
Red Cross and Red Crescent teams on the ground can’t always answer these questions on their own. Thanks to technology, collaboration from around the world, and data crunching, answers are coming more quickly. This empowers teams—who are working in often very difficult environments—to better assist people in need.
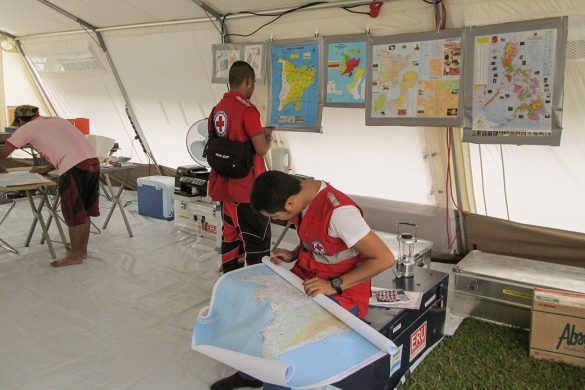
For several years, the Red Cross has been working on innovative mapping projects to help communities prepare for and respond to disasters. Updated maps can expedite the delivery of emergency supplies, determine where help is needed most, and even track the spread of diseases like Ebola. After Typhoon Haiyan in the Philippines and the Nepal earthquake, disaster responders used crowd-sourced mapping data to navigate their way to people in need and assess places with the most damage.
Today, the American Red Cross and the International Federation of Red Cross and Red Crescent Societies (IFRC) are announcing another innovation in the field: a collaboration with Facebook around Disaster Maps that uses aggregated Facebook data to show where communities are located after a disaster, where they are moving, and where they are checking in as ‘safe.’
Using anonymized Facebook data, the Red Cross hopes to see where families sheltered the storm and when/if they are returning to devastated areas. This data—combined with other datasets—might be able to help the Red Cross better target relief supplies to the families and communities most in need during the critical days after large-scale disasters.
“Today, we are introducing disaster maps that use aggregated, de-identified Facebook data to help organizations address the critical gap in information they often face when responding to natural disasters. We believe that this information will help response organizations paint a more complete picture of where affected people are located so they can determine where resources are needed and where people are out of harm’s way,” remarked Molly Jackman, Public Policy Research Manager, Facebook. “We’re grateful for the help of our partners—UNICEF, American Red Cross and IFRC Red Crescent, and the WFP—who have worked with us to identify what data would be most helpful and how it could be put to action in the moments following a disaster.”
This isn’t the first time that the Red Cross has partnered with Facebook on understanding how increasingly accurate maps can address important data gaps when responding to emergencies.
Crowd-sourced maps do good around the globe
Accurate maps play a critical role in understanding communities and neighborhoods— especially for populations at risk of emergencies. While much of the world has been mapped to incredible detail, millions of people in developing countries live in communities that do not exist on any digital maps. This leaves them less visible to decision-makers and makes it more difficult to provide assistance during crises.
Over the past decade, humanitarian organizations—including the Red Cross and Red Crescent—have added open-sourced maps to their arsenal of disaster preparedness and response. These new tools are helping emergency responders deliver aid more quickly and support volunteers to fight diseases like measles.
Through the Missing Maps project, the American Red Cross and other humanitarian organizations are using the power of crowdsourcing to trace buildings and roads from satellite imagery in order to create detailed base maps. This information is added to OpenStreetMap—a free and editable world map. Local volunteers then use this information on the ground. They literally walk around neighbourhoods and add detail to the maps, such as health facilities, water points, and schools.
Through this process, the American Red Cross and its partners have engaged more than 28,000 volunteers to put 40 million people on the map. Mapping has helped with efforts to prevent malaria, develop a water pipeline, vaccinate against measles and support disaster preparedness.
These results are noteworthy, but the process can be made more efficient. In a rural context, volunteers often scan through huge areas of satellite imagery to search for rural hamlets and villages. A lot of volunteer time is spent finding something to map rather than doing the actual mapping. It can be very difficult to locate accurate, timely, and detailed population information for many countries. This information plays an important role in program planning.
For these reasons, the American Red Cross is excited to explore the use of Facebook’s population datasets for its projects.
Fighting measles with maps
The Red Cross recently utilized Facebook data for an upcoming measles vaccination campaign in Malawi. Measles is extremely contagious and remains a major cause of mortality for young children in many countries. As part of the Measles & Rubella Initiative, the American Red Cross and other partners are supporting a vaccination campaign to immunize more than 7.5 million children across the country in June—and the Red Cross’s mapping team is conducting pilot efforts to integrate mapping into the work.
The first step for teams was developing a rich base map for Malawi. At the beginning of planning, the Red Cross used Facebook data to identify population settlements across the country—and to identify areas which were already detailed in OpenStreetMap. This helped teams differentiate between areas that needed to be mapped by local volunteers and areas that could be skipped (where nobody lived). This increased efficiency dramatically.
Much of Malawi is rural, so concentrating on population settlements allowed us to filter out 97.1% of the total land area that we sought to map. This technique reduced our mapping area from 94,080 to 2,745 square kilometres.
Volunteers could then spend their time mapping communities instead of searching through acres of uninhabited areas; they were able to complete the mapping in a fraction of the normal time.
The base map data will support monitoring activities in the field. During the measles vaccination campaign, monitors from the national government, Red Cross, and other local partners will visit areas where vaccinations took place the previous day. They will identify areas that are especially at-risk and conduct spot checks: performing randomized surveys, locating children in public places to get a sense of whether the area was covered successfully. This information allows local health staff to identify areas where children may have been missed—and means that staff can make more informed decisions about whether to adjust resources and return to those areas again.
Rather than collect monitoring information using a traditional paper-based method, monitors will use mobile phones equipped with a data collection app that transmits information to the Cloud. The results will feed into a dashboard with an interactive map (created using the new base map data) and figures that show the results as they are collected. This means health staff and partners across the country will have access to real-time information about areas that need more attention during the campaign.
This is more than innovation. It’s saving lives.
“Accurate maps empower Red Cross and Red Crescent teams to carry out humanitarian missions around the world. Maps help us in so many ways – from distributing relief supplies to preparing communities for disasters,” said Jono Anzalone, Vice President of International Services for the American Red Cross. “By sharing anonymized location, movement, and safety check data with the American Red Cross, Facebook is helping us sharpen the essential tools we need for targeting communities in need, delivering aid, and fighting disease,” he remarked.