Ny rekord for verdens udviklingsbistand i 2013 efter nogle magre år – Storbritannien satte trumf på og de 19 EU-lande, der er med i OECDs bistandskomite (DAC), leverede godt 70 milliarder af de i alt knapt 135 milliarder dollars til u-landene – men mindre til Afrika syd for Sahara.
PARIS, 8. April 2014: Development aid rose by 6.1% in real terms in 2013 to reach the highest level ever recorded, despite continued pressure on budgets in OECD countries since the global economic crisis.
Donors provided a total of 134.8 billion US dollar (ca. 722 milliarder DKR) in net official development assistance (ODA), marking a rebound after two years of falling volumes, as a number of governments stepped up their spending on foreign aid.
An annual survey of donor spending plans by the OECD Development Assistance Committee (DAC) indicated that aid levels could increase again in 2014 and stabilise thereafter.
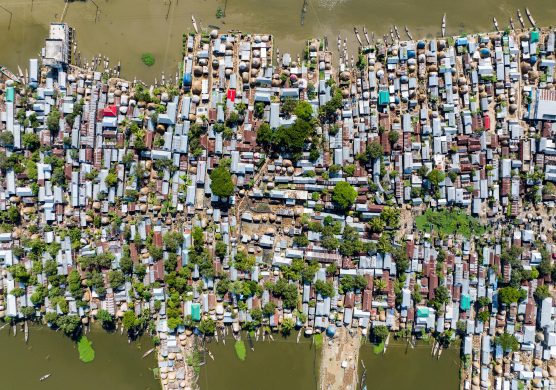
However, a trend of a falling share of aid going to the neediest sub-Saharan African countries looks likely to continue.
“It is heartening to see governments increasing their development aid budgets again, despite the financial constraints they are currently facing,” said OECD Secretary-General Angel Gurría, adding:
“However, assistance to some of the neediest countries continues to fall, which is a serious concern. We will need to address this issue when the Global Partnership for Effective Development Co-operation meets in Mexico next week, as well as the broader challenge of how to make the most of ODA in a growing pool of resources for development finance.”
Key aid figures in 2013
In all, 17 of the DAC’s 28 member countries increased their ODA in 2013, while 11 reported a decrease. Net ODA from DAC countries stood at 0.3% of gross national income (GNI.) Five countries met a longstanding UN target for an ODA ratio of 0.7% of GNI (bruttonationalindkomsten).
The United Kingdom increased its ODA by 27.8% to hit the 0.7% target for the first time. The United Arab Emirates posted the highest ODA/GNI ratio, 1.25%, after providing exceptional support to Egypt.
Aid to developing countries grew steadily from 1997 to a first peak in 2010. It fell in 2011 and 2012 as many governments took austerity measures and trimmed aid budgets.
The rebound in aid budgets in 2013 meant that even excluding the five countries that joined the DAC in 2013 (Czech Republic, Iceland, Poland, Slovak Republic and Slovenia), 2013 DAC ODA was still at an all-time high.
Shifting aid allocations
Within bilateral net ODA, non-grant disbursements (including equity acquisitions) rose by about 33% in real terms from 2012. Total grants rose 7.7% in real terms; excluding debt forgiveness grants, they rose 3.5%.
Net aid for core bilateral projects (excluding debt relief grants and humanitarian aid) rose by nearly 2.3% in real terms and core contributions to multilateral institutions by 6.9% (see Chart 2).
Bilateral aid to sub-Saharan Africa was 26.2 billion dolllar, a decrease of 4.0% in real terms from 2012.
Aid to the African continent fell by 5.6% to 28.9 billion dollar.
Excluding debt relief, which was high in 2012 due to assistance to Ivory Coast, net aid in real terms rose by 1.2% to sub-Saharan Africa but fell by 0.9% to the continent as a whole.
Bilateral net ODA to the Least Developed Countries (LDCs) rose by 12.3% in real terms to about 30 billion dollar. However, there was exceptional debt relief for Burma in 2013. Details on the impact of debt relief on aid flows to LDCs will be available later this year.
Donor performance
The largest donors by volume were the United States, the United Kingdom, Germany, Japan and France.
DENMARK, Luxembourg, Norway and Sweden continued to exceed the 0.7% ODA/GNI target and the UK met it for the first time. The Netherlands fell below 0.7% for the first time since 1974.
Net ODA rose in 17 countries, with the largest increases recorded in Iceland, Italy, Japan, Norway and the UK. It fell in 11 countries, with the biggest decreases in Canada, France and Portugal.
The G7 countries provided 70% of total net DAC ODA in 2013, and the DAC-EU countries 52%.
The US remained the largest donor by volume with net ODA flows of 31.5 billion dollar, an increase of 1.3% in real terms from 2012. US ODA as a share of GNI was 0.19%.
Most of the increase was due to humanitarian aid and support for fighting HIV/AIDS.
By contrast US net bilateral aid to LDCs fell by 11.7% in real terms to 8.4 billion dollar due in particular to reduced disbursements to Afghanistan. Net ODA disbursements to sub-Saharan Africa fell by 2.9% to 8.7 billion dollar.
ODA from the 19 EU countries that are DAC members was 70.7 billion dollar, a rise of 5.2% in real terms from 2012, and 0.42% of their combined GNI.
ODA rose or fell in DAC-EU countries as follows:
* Austria (+0.7%)
* Belgium (-6.1%): due to lower levels of debt relief in 2013 compared to 2012
* Czech Republic (-4.7%): due to a decrease in bilateral aid to Afghanistan
* Denmark (+3.8%): as it increased its bilateral aid
I 2012 lå bistandsprocenten en anelse lavere på 0,83 pct. af BNI. Opgørelsen er foreløbig, da den bl.a. bygger på skøn for Danmarks BNI for 2013. Den endelige bistandsprocent for 2013 forventes offentliggjort i december 2014.
* Finland (+3.5%): reflecting an overall scaling up of its aid
* France (-9.8%): due to lower levels of loans disbursements and debt relief compared to 2012
* Germany (+3.0%): due to a rise in bilateral lending and higher contributions to international organisations
* Greece (-7.7%): due to austerity measures
* Ireland (-1.9%): despite continued budgetary pressures, Ireland has largely stabilised allocations to ODA, with 2013 volumes marginally decreasing on the 2012 levels
* Italy (+13.4%): the Italian government had made a firm commitment to increase its ODA allocations to 0.16% of GNI in 2013 and reached this target
* Luxembourg (+1.2%)
* Netherlands (-6.2%): its ODA/GNI ratio fell below 0.7% due to overall aid budget cuts; the Netherlands says it remains committed to the 0.7% target and to innovative, results-oriented support mechanisms and partnerships to increase the leverage of its development efforts
* Poland (+8.6%): due to increased contributions to EU Institutions
* Portugal (-20.4%): due to financial constraints leading to budget cuts
* Slovak Republic (+2.4%)
* Slovenia (-0.6%)
* Spain (+3.7%):due to debt relief operations in sub-Saharan Africa
* Sweden (+6.3%): due to increases in its bilateral aid and aid to international organisations
* UK (+27.8%): as it put into place firm budget allocations to meet the 0.7% ODA/GNI target.
In 2013, net ODA by the 28 EU member states was 71.2 billion dollar, or 0.41% of their combined GNI.
Net disbursements by EU Institutions to developing countries and multilateral organisations were 15.9 billion dollar, a fall of 13.1% from 2012, due especially to a lower volume of concessional loans.
Net ODA rose or fell in other DAC countries as follows:
* Australia (-4.5%): as it delayed expenditure due to reprioritisation of its aid program to focus on the Indo-Pacific region. Australia’s aid remains stable and on track for an estimated expenditure of A$ 5 billion in 2013-14.
* Canada (-11.4%): due to exceptional payments made in 2012 for climate change and debt relief and to budget cuts affecting 2013
* Iceland (+27.4%): as it is increasing its aid programme;
* Japan (+36.6%): due to increases in debt forgiveness and bilateral lending
* South Korea (+4.8%): due to scaling up aid overall
* New Zealand (-1.0%): due to an increasing aid programme being offset by inflation
* Norway (+16.4%): due to planned growth in the development cooperation budget, together with an increase in disbursements to Brazil
* Switzerland (+3.4%): reflecting the overall scaling up of its aid to reach 0.5% of GNI by 2015.
Other donor countries reported preliminary ODA figures as follows:
* Estonia (+22.3%): due to increases in humanitarian aid and contributions to EU Institutions
* Hungary (-2.1%)
* Israel (-6.2%)
* Latvia (Letland) (+12.2%)
* Russia (+26.4%): due to an increase in bilateral aid
* Turkey (+29.7%): continuing the significant expansion of its development co-operation programme in recent years; the large increase in 2013 is due in part to the crisis in Syria
* UAE (Emiraterne) (+375.5%): due to exceptional measures to address financial and infrastructure needs in Egypt; its ODA/GNI ratio rose to 1.25%, the largest reported share of any country in 2013.
In 2013, DAC countries’ gross ODA (i.e. without deducting loan repayments) was 151.2 billion dollar, an increase of 9.5% in real terms from 2012. Within bilateral gross ODA, non-grant financial instruments rose by 27.3% in real terms, representing nearly 18 billion dollar.
The largest donors on a gross basis were the US, Japan, the UK, Germany and France.
Further outlook
Læs videre på
http://www.oecd.org/newsroom/aid-to-developing-countries-rebounds-in-2013-to-reach-an-all-time-high.htm
Se også Henrik Nielsens blog på
http://www.u-landsnyt.dk/blog/337/nye-bistandstal-fra-oecddac